GNSS
-
Import
-
Baselines
-
Adjustment
-
Lists and Charts
-
Report
6.1 Import
6.1.1 Import Data
Click GNSS menu, click [Import] button, select GNSS observation files in local path and import them. RINEX format and TRS format are supported, and multiple files selection is supported by CTRL or SHIFT keys.
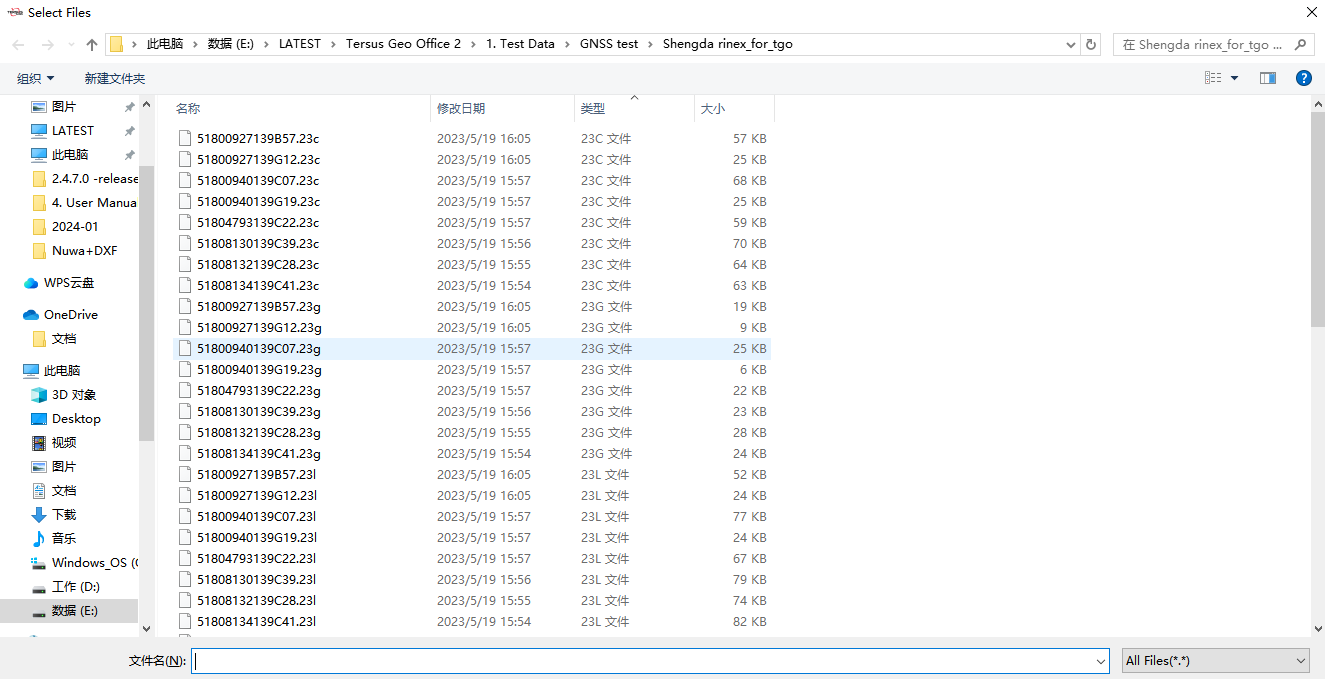
Figure 6.1 Import GNSS Data
Click Open to start importing the selected files, wait for the process bar to complete.

Figure 6.2 Import Data Process Bar
After importing files, if the coordinate system of current project has not been configured, the software will prompt and ask whether to set Transverse Mercator as the default projection. If the central meridian of the configured coordinate system for current project differs greatly from the sites in imported files, the software will prompt whether to modify the central meridian , then the coordinates system configuration dialog will be opened and the central meridian will be set to the average longitude of sites if you click Yes.

Figure 6.3 Prompt for Editing Central Meridian
After importing GNSS files and configuring the correct coordinate system parameters, a graphical representation of the sites, baselines and their relationships will be displayed in projection coordinates in the view interface. Items of sites, files, baselines and loops will be displayed in Work Space window. If a site or baseline is selected in view, the item in work space window will be highlighted and more information will be displayed in properties window.
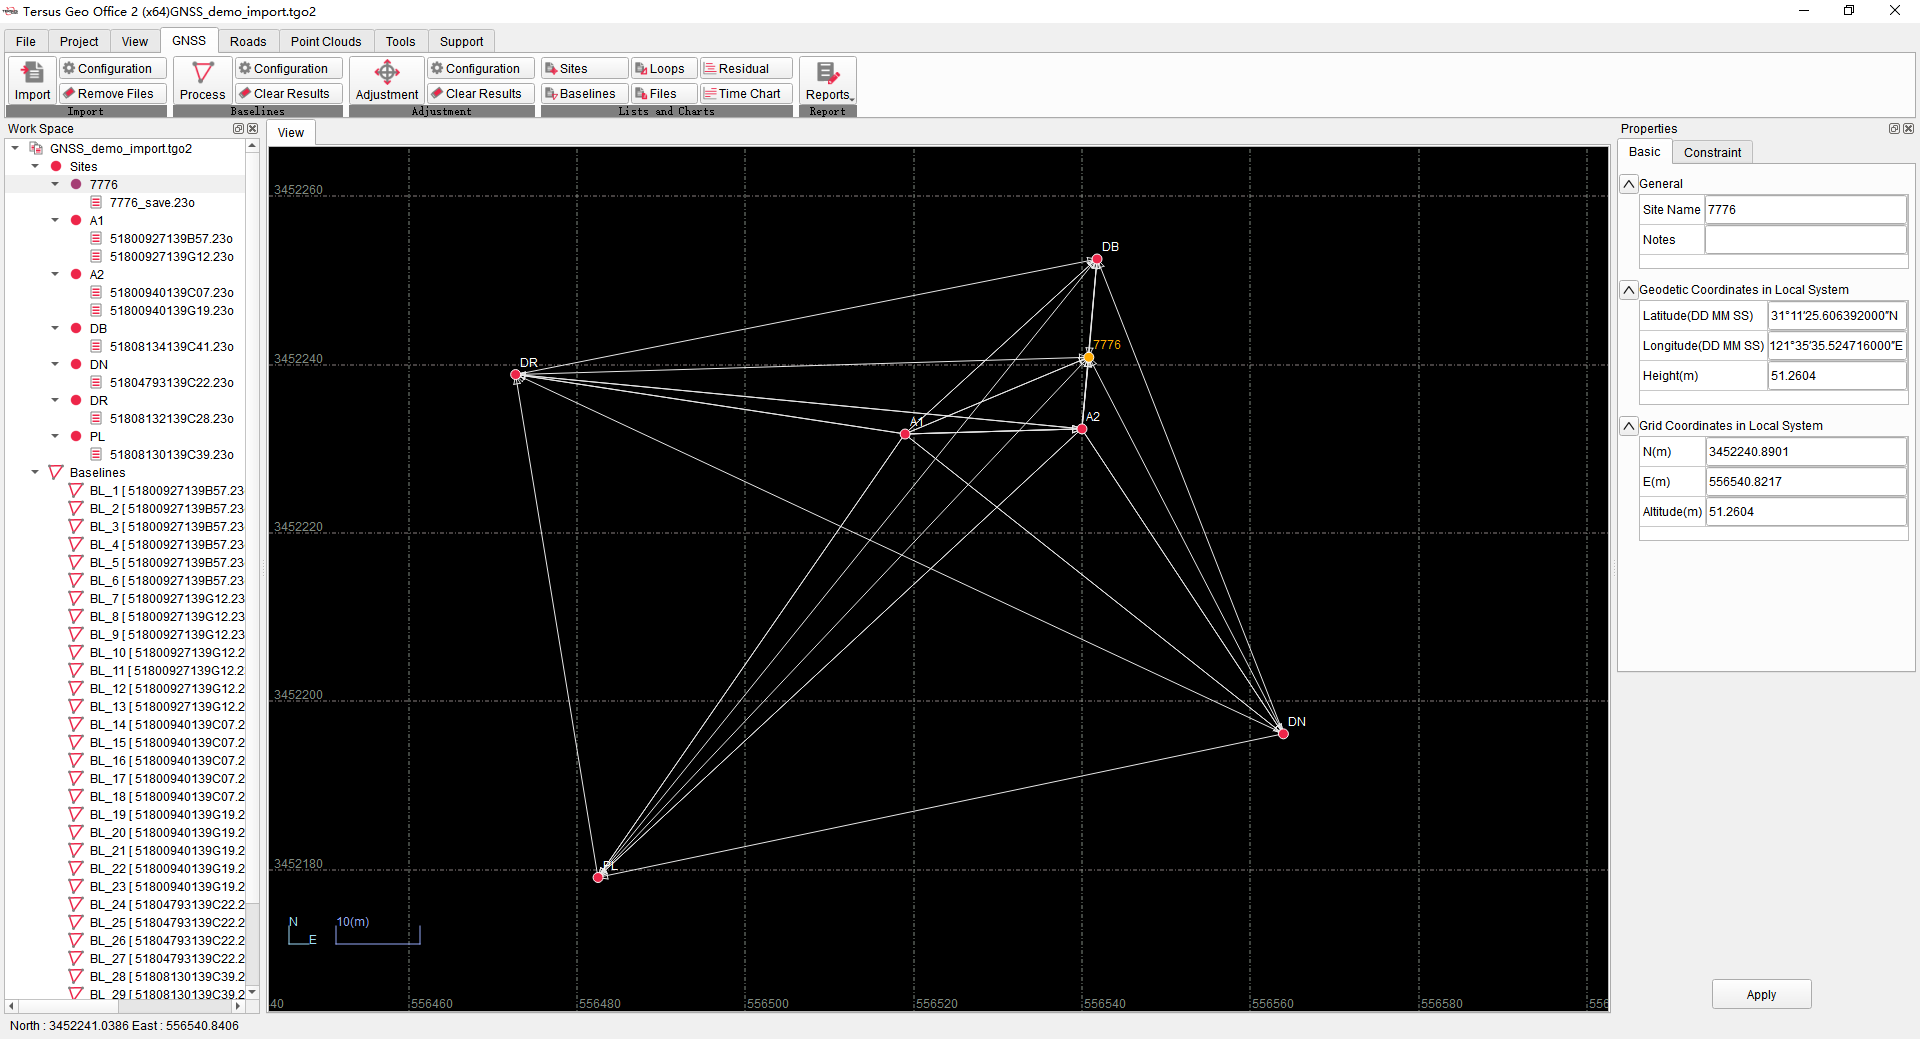
Figure 6.4 After Data Import
Click GNSS menu, click [Files] button, to display imported GNSS observation files in list. Click to select files in the Files list, to display and modify Site Name, Receiver information and Antenna parameters of the selected file.
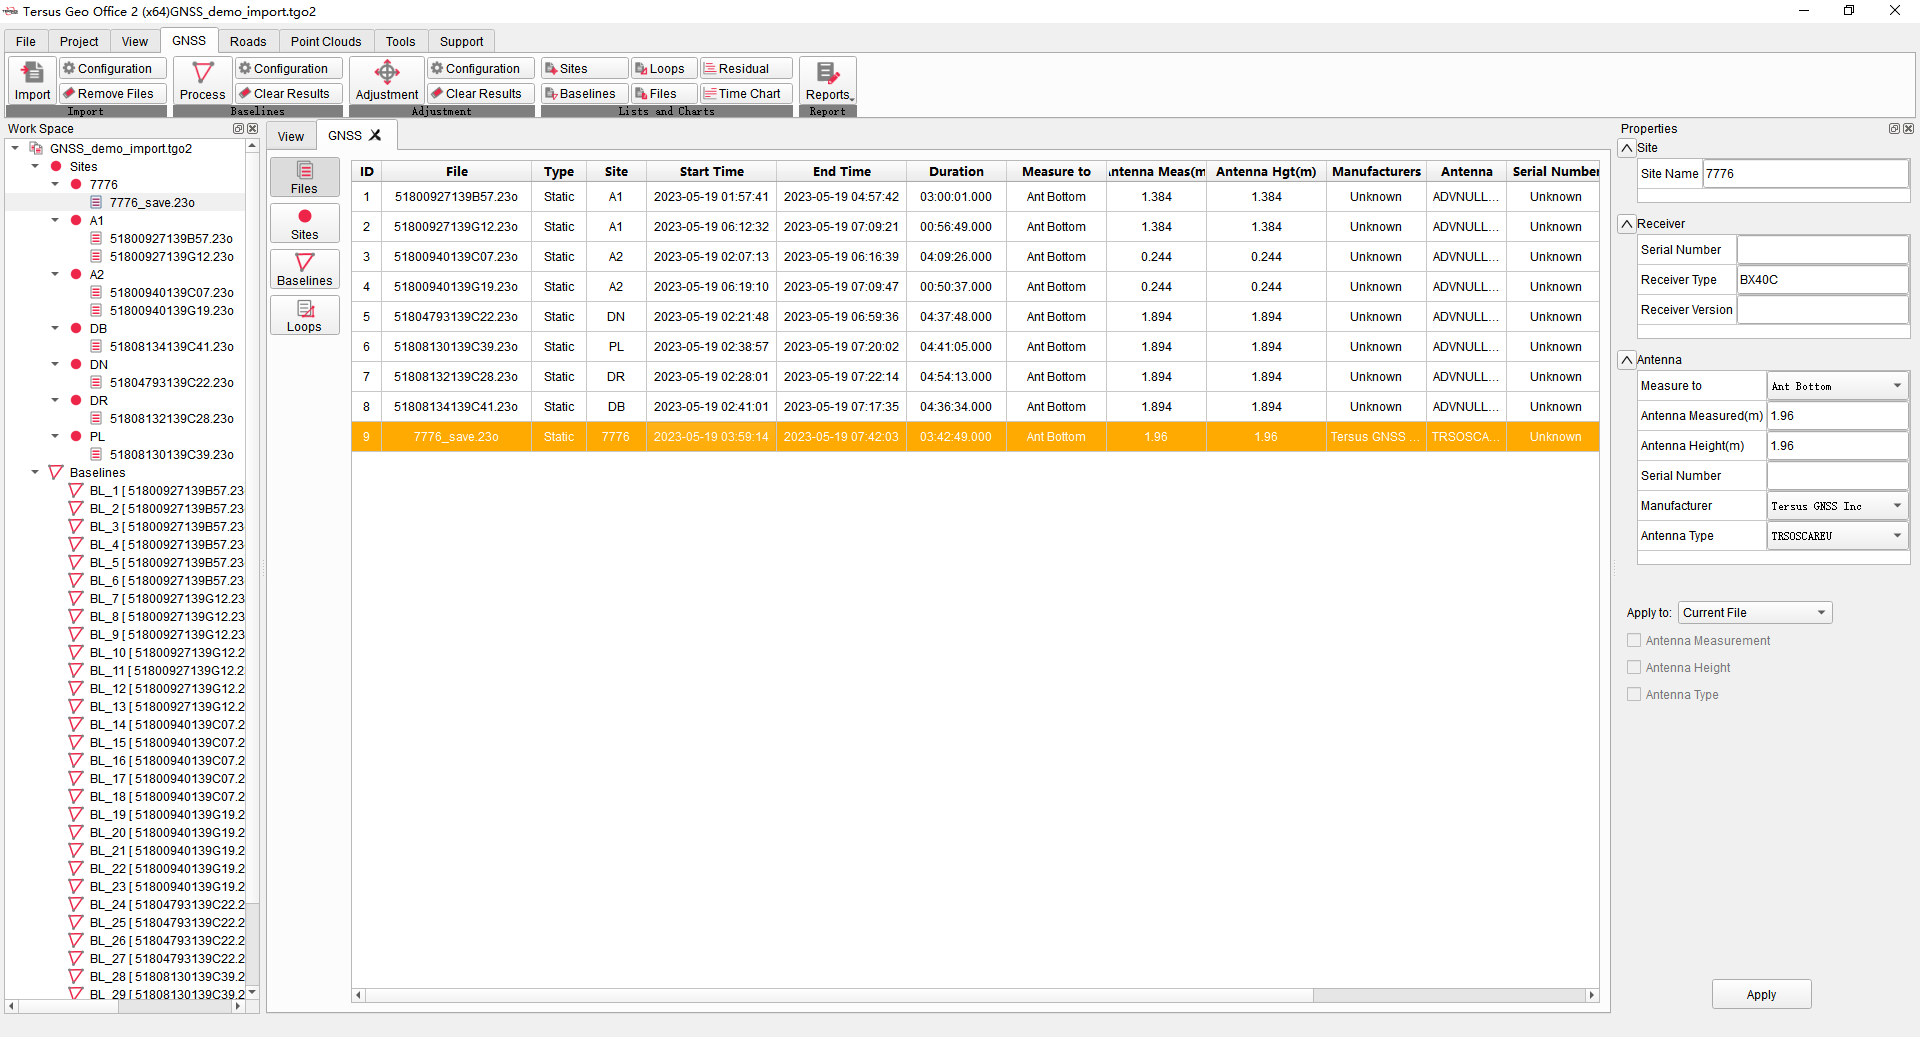
Figure 6.5 Files List
When modifying antenna parameters, select [Measure to] [Ant Bottom], which means the vertical height from the ground point to the antenna bottom, or [Slant Height], which means the slant distance from the ground point to 13cm length measuring board. Enter [Antenna Measured], that is the reading in antenna measurement, and the software will automatically calculate [Antenna Height] of the antenna reference point. Select the correct antenna [Manufacturer] and [Antenna Type] for software to calculate the antenna phase center height. After modification, choose to apply to the current file or other more files.
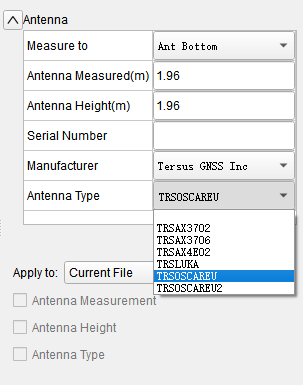
Figure 6.6 Antenna Parameters Modifying
6.1.2 Import Configuration
Click GNSS menu, click import configuration, open the import configuration dialog, where to edit parameters of baselines rules, sites merging rules and loops rules.
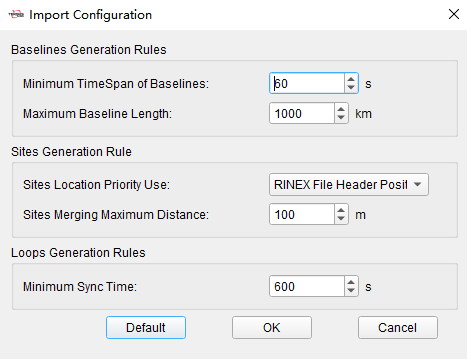
Figure 6.7 Import Configuration
+----------------------------+--------------------------------+---------------------------------------------------------------------------------------------------------------------------------------------------------------------------------------------------------------------------------------------------------------------------------------------------------------------------------------------------+ | Baselines Generation Rules | Minimum Time Span of Baselines | The default is 60 seconds. Software will not generate a baseline between sites if the synchronization time of sites is less than this configured threshold. | +----------------------------+--------------------------------+---------------------------------------------------------------------------------------------------------------------------------------------------------------------------------------------------------------------------------------------------------------------------------------------------------------------------------------------------+ | | Maximum Baseline Length | The default is 1000 km. Software will not generate a baseline between sites if the distance is greater than this configured threshold. | +----------------------------+--------------------------------+---------------------------------------------------------------------------------------------------------------------------------------------------------------------------------------------------------------------------------------------------------------------------------------------------------------------------------------------------+ | Sites Generation Rules | Sites Location Priority Use | The default is Autonomous Position, which means the calculated value of the autonomous position in the observation files will be used as the sites coordinates. It could be changed to RINEX File Header Position, which means the calculation of approximate coordinates in RINEX file header if recorded will be used as the sites coordinates. | +----------------------------+--------------------------------+---------------------------------------------------------------------------------------------------------------------------------------------------------------------------------------------------------------------------------------------------------------------------------------------------------------------------------------------------+ | | Sites Merging Maximum Distance | The default is 100 meters. When importing two or more files recorded as the same site name, and the distance between their autonomous positions is less than this configured threshold, software will consider the files are observed on the same site at different times and record them under one site in work space window. | | | | | | | | When importing two or more files recorded at the same name, and the distance between their autonomous position is greater than this configured threshold, software will consider the files are not observed on the same site but wrongly recorded as the same name, then will automatically rename it as a different site. | +----------------------------+--------------------------------+---------------------------------------------------------------------------------------------------------------------------------------------------------------------------------------------------------------------------------------------------------------------------------------------------------------------------------------------------+ | Loops Generation Rules | Minimum Sync Time | The default is 600 seconds. If the synchronization time of the three baselines or the three sites that make up the closed loop is greater than this this configured threshold, software will consider the loop to be a synchronous loop, otherwise it is an asynchronous loop. | +----------------------------+--------------------------------+---------------------------------------------------------------------------------------------------------------------------------------------------------------------------------------------------------------------------------------------------------------------------------------------------------------------------------------------------+
6.1.3 Remove Files
Click GNSS menu, click remove files, to clear all GNSS data in the current project.
6.2 Baselines
6.2.1 Baselines Process
After importing GNSS files and completing modification, click GNSS menu, click [Process] button, to process all baselines.

Figure 6.8 Baseline Process
Wait for the process bar to complete. After baselines process, baselines will be displayed in different colors in view interface to indicator that baselines have been processed. Click [Baselines] under GNSS menu, to show baselines parameters in list.
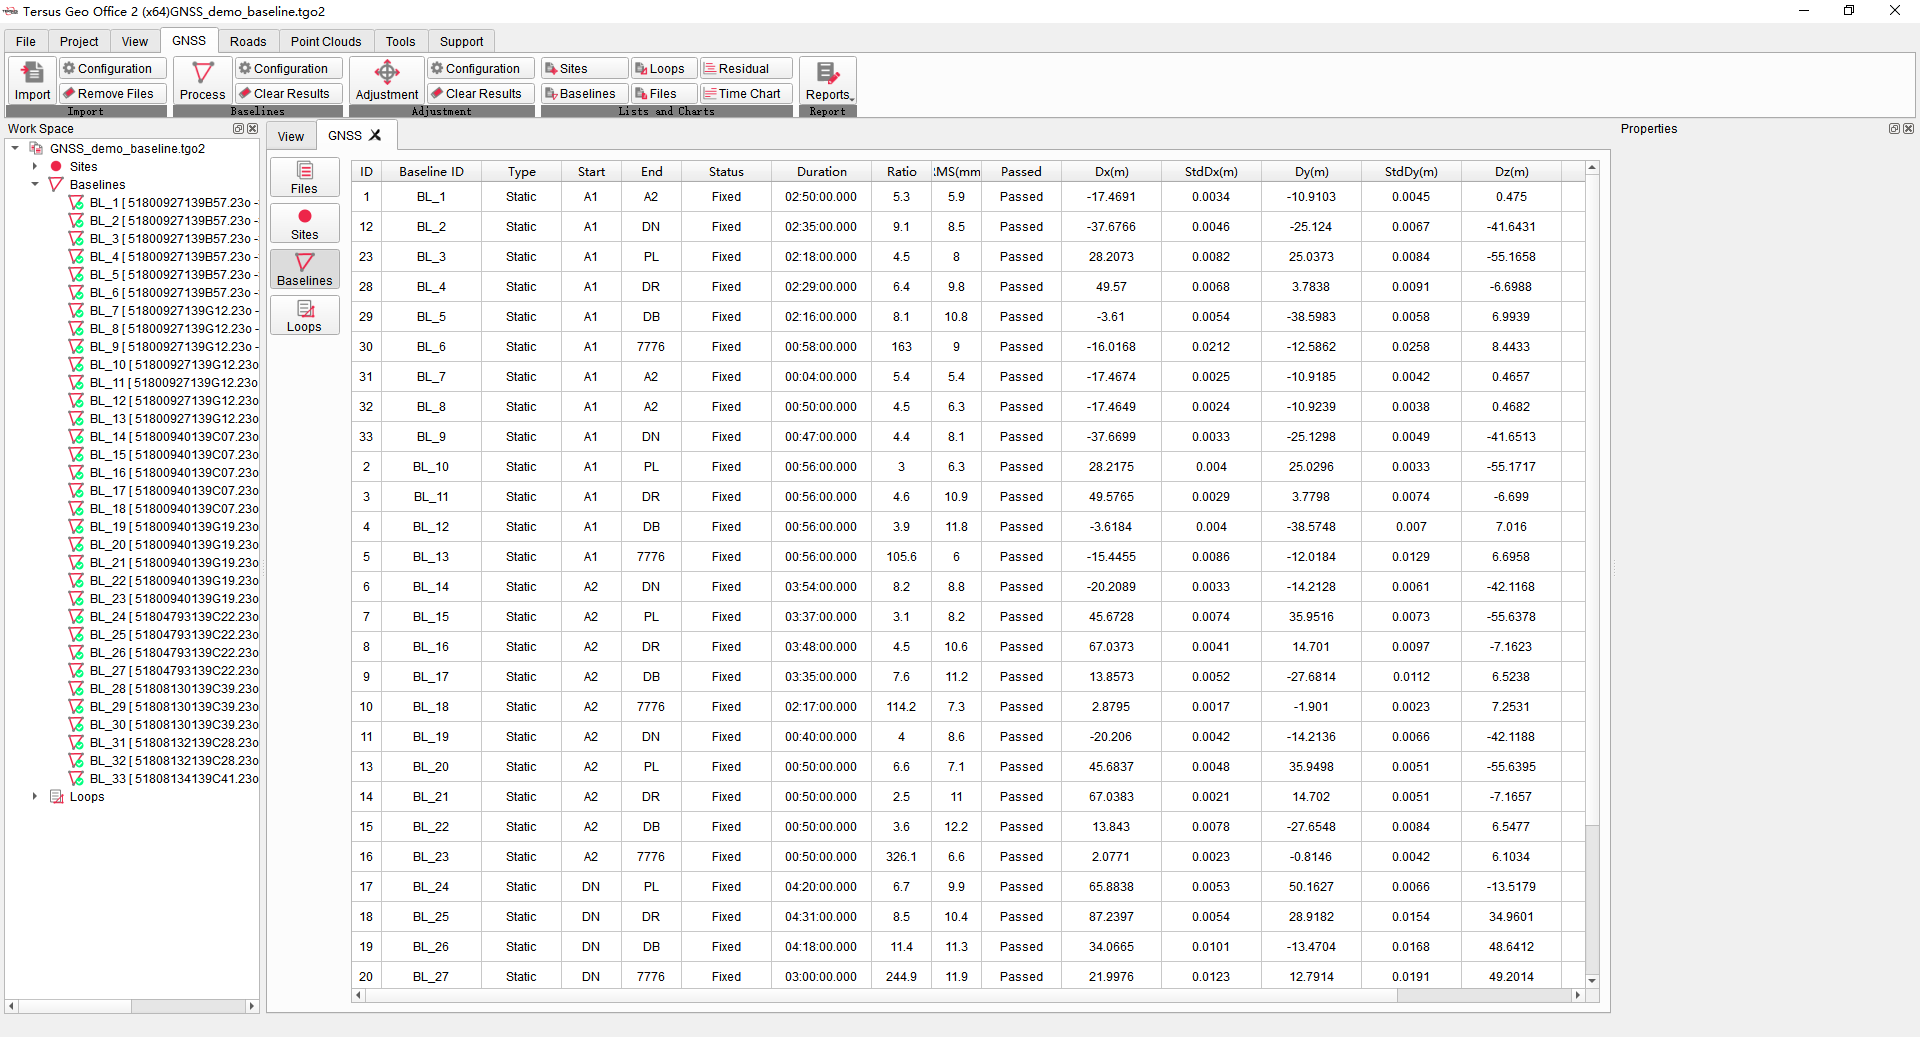
Figure 6.9 Baseline List
Select one or several baselines in view interface or work space window, click the right mouse button to process only selected baselines.
6.2.2 Residual Process
After baselines process, if some of baselines solution cannot get fixed, or RMS values in baselines solution are large, select the baseline and right-click on [Residual Plot] to open residual plot of the selected baseline to process and improve the precision.
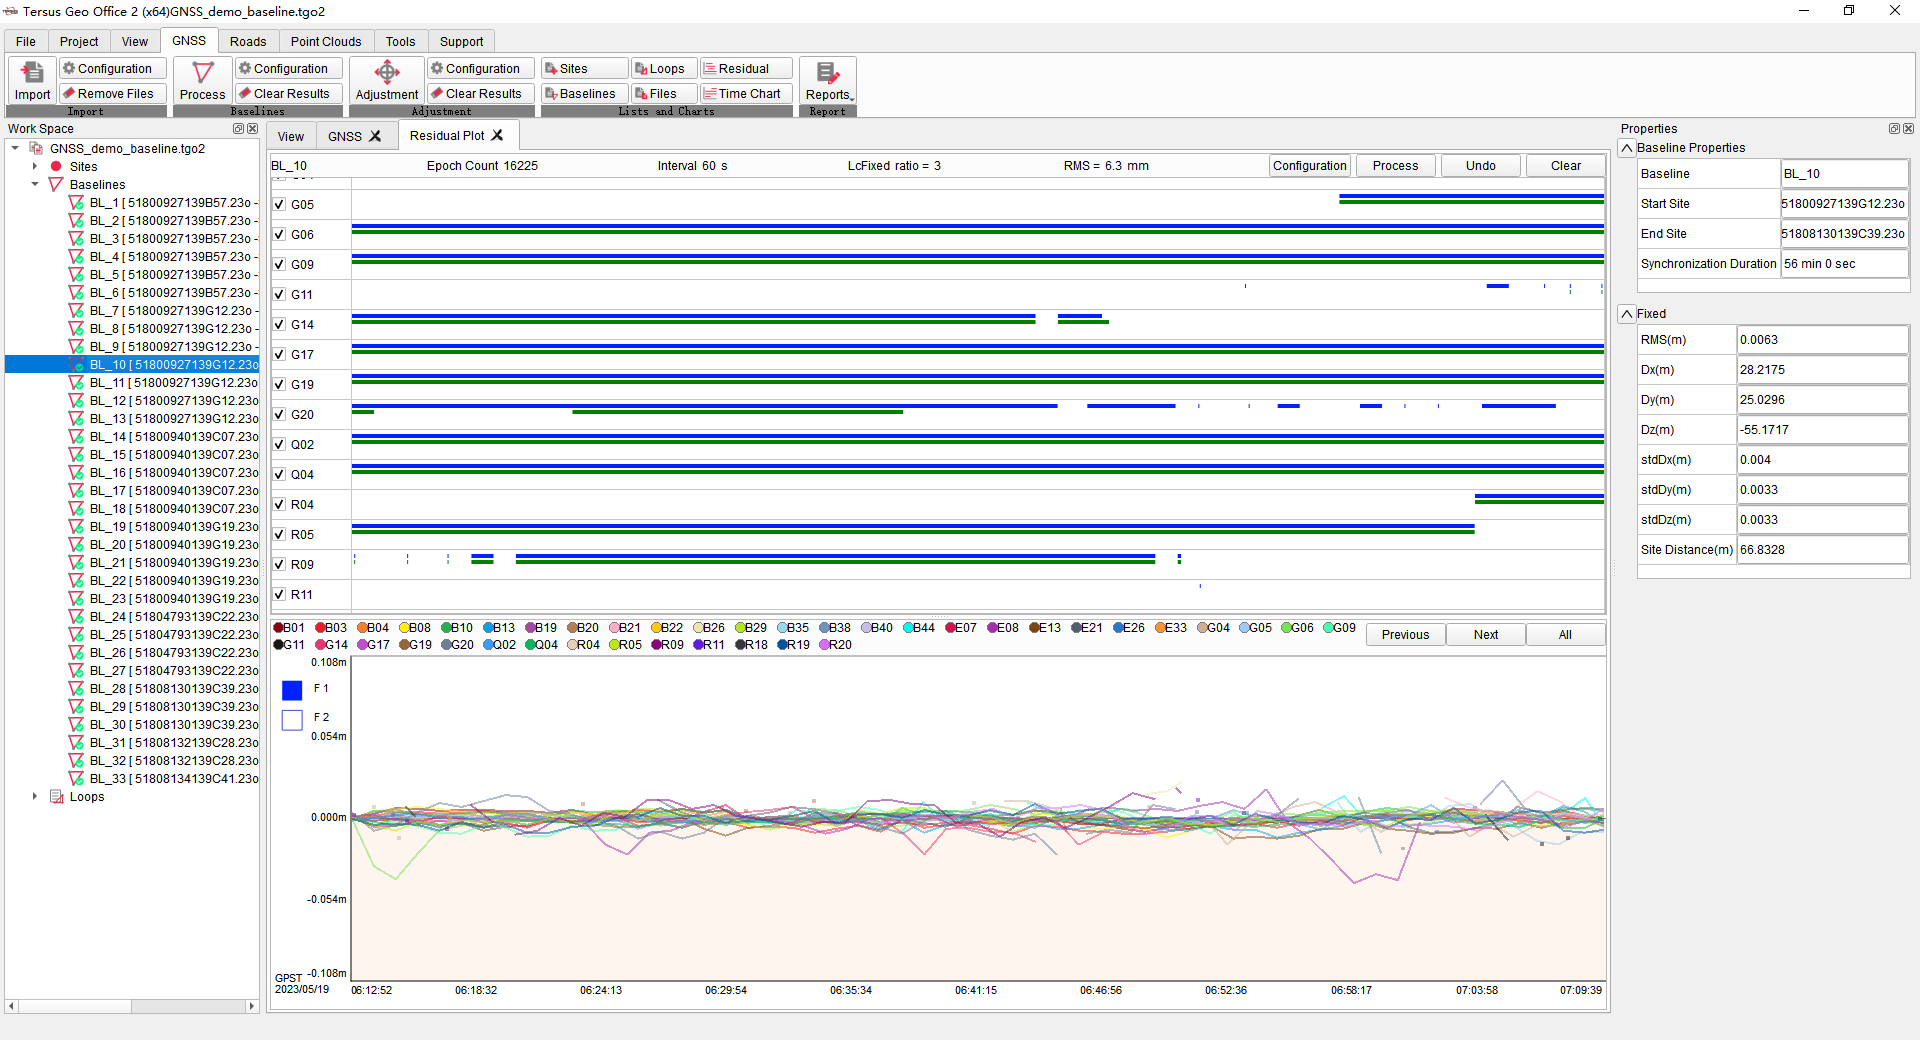
Figure 6.10 Residual Plot
In the residual plot interface, the upper part shows the observation of each satellite and frequency, the lower part shows the residual of satellites compared with the reference satellite in each epoch during the baseline processing. The residual of each satellite can be displayed by clicking on the satellite number in the lower part or by clicking [Previous] and [Next] buttons. The displayed residuals can be zoomed on the vertical axis by using the mouse wheel.
According to the residuals, disable or enable the satellite by click the check box before satellite name in the upper part. Or click and drag to draw a box on the satellite observation data bar to delete the observation data corresponding to the larger part of the residuals. After residuals process, click [Process] to re-process the baseline and check the change in RMS value to see if a higher precision result is obtained.
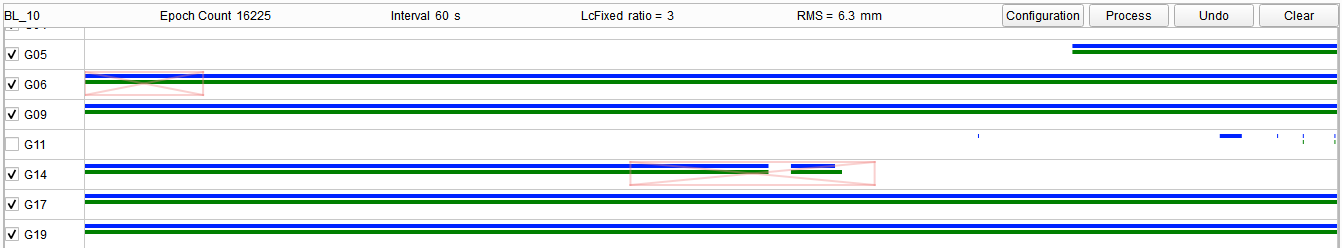
Figure 6.11 Satellites and Observation Process
6.2.3 Process Configuration
Click GNSS menu, click Process Configuration, open the process configuration dialog, where to edit parameters of baseline process, atmospheric model and baseline processing quality thresholds.
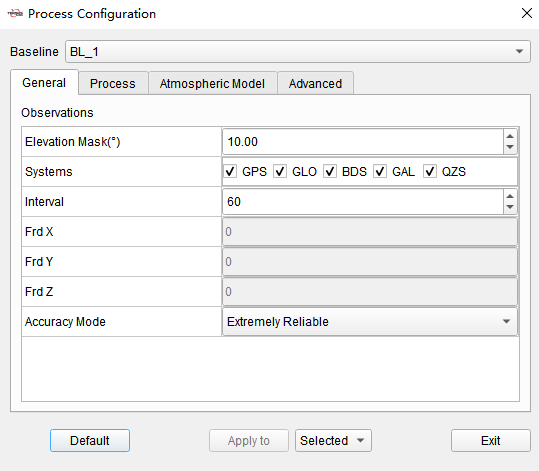
Figure 6.12 Process Configuration
+---------------------+----------------------+--------------------------------------------------------------------------------------------------------------------------------------------------------------------------------------------------------------------------------------------------------------------------+ | General | Elevation Mask | The default is 10 degrees. Only satellites with elevation angle greater than this configured threshold will be computed during baseline process. | | | | | | Observations | | | +---------------------+----------------------+--------------------------------------------------------------------------------------------------------------------------------------------------------------------------------------------------------------------------------------------------------------------------+ | | Systems | Satellite system used in baseline process. | +---------------------+----------------------+--------------------------------------------------------------------------------------------------------------------------------------------------------------------------------------------------------------------------------------------------------------------------+ | | Interval | The default is 60 seconds. Sampling the observation data for processing according to the configured interval, and the smaller the sampling interval, the larger amount of processed data. | +---------------------+----------------------+--------------------------------------------------------------------------------------------------------------------------------------------------------------------------------------------------------------------------------------------------------------------------+ | | Frd X /Y / Z | Not configurable. | +---------------------+----------------------+--------------------------------------------------------------------------------------------------------------------------------------------------------------------------------------------------------------------------------------------------------------------------+ | | Accuracy Mode | The algorithm strategy during baseline process. The options are Rapid Fix, Balanced and Extremely Reliable. Rapid Fix, software will prioritize solutions where baselines get fixed. Extremely Reliable, software will prioritize the accuracy when baselines are fixed. | +---------------------+----------------------+--------------------------------------------------------------------------------------------------------------------------------------------------------------------------------------------------------------------------------------------------------------------------+ | Process | Process Mode | The options are Auto, Static and PPK. When Auto is selected, software will select static or PPK mode according to the observation file type. | | | | | | Process Mode | | | +---------------------+----------------------+--------------------------------------------------------------------------------------------------------------------------------------------------------------------------------------------------------------------------------------------------------------------------+ | Atmospheric Model | Troposphere Model | Not configurable. The Hopfield tropospheric model is used during baseline process. | +---------------------+----------------------+--------------------------------------------------------------------------------------------------------------------------------------------------------------------------------------------------------------------------------------------------------------------------+ | Meteorological Data | Temp / Press / Humid | Not configurable. The default parameters is used during baseline process. | +---------------------+----------------------+--------------------------------------------------------------------------------------------------------------------------------------------------------------------------------------------------------------------------------------------------------------------------+ | Advanced | RMS Limit | The default is 0.04 m. If the RMS value in processing result is greater than this configured threshold, software will consider it fails. | | | | | | Quality Control | | | +---------------------+----------------------+--------------------------------------------------------------------------------------------------------------------------------------------------------------------------------------------------------------------------------------------------------------------------+ | | Frequency | Not configurable. Software automatically determines the combination of frequencies during baseline process. | +---------------------+----------------------+--------------------------------------------------------------------------------------------------------------------------------------------------------------------------------------------------------------------------------------------------------------------------+ | Advanced | Use LC Combine | Not configurable. Software uses a combination of LC observations during baseline processing. | +---------------------+----------------------+--------------------------------------------------------------------------------------------------------------------------------------------------------------------------------------------------------------------------------------------------------------------------+
6.2.4 Clear Process Results
Click Clear Process Results under GNSS menu, to clear the processing results of all baselines and revert to the state when they were not processed.
6.3 Adjustment
6.3.1 Constraints
After baseline processing and before network adjustment, if there are sites with known coordinates, click [Sites] button under GNSS menu and select the sites in the list, then click [Constraint] in Properties window to enter known coordinates.
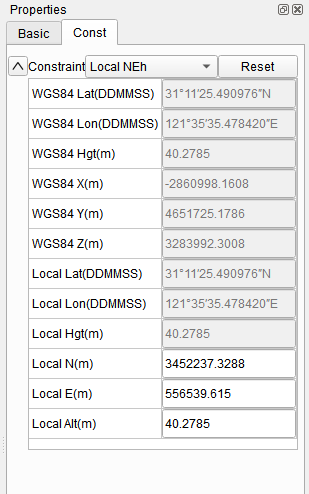
Figure 6.13 Known Coordinates
According to the adjustment requirements and known coordinates, select to input WGS84 XYZ coordinates, WGS84 Lat/Lon/H coordinates, Local Lat/Lon/H coordinates or Local N/E/h coordinates. Save the constraints and the sites with known coordinates will be marked by red triangle in the sites list.
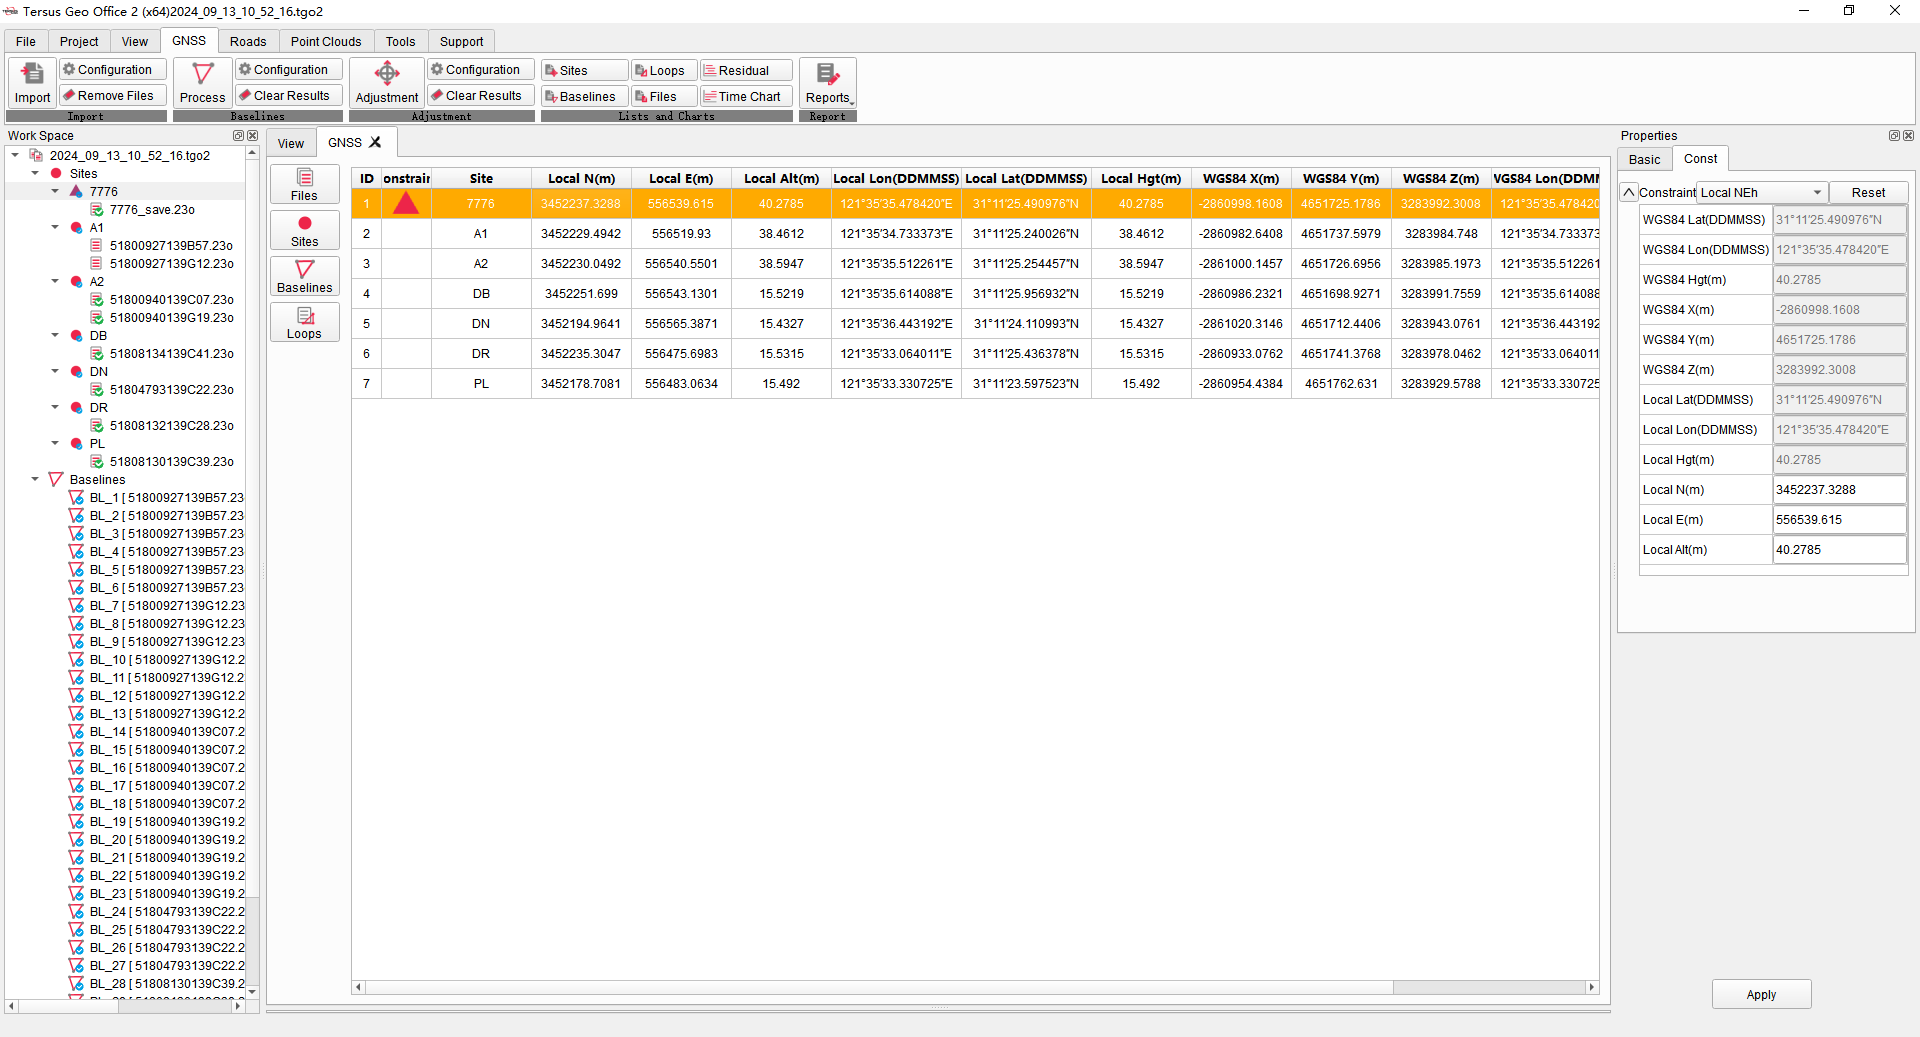
Figure 6.14 Site with Constraints
6.3.2 Adjustment
Click [Adjustment] button under GNSS menu, open the adjustment dialog. Select Auto and click [Adjust], then software will perform network adjustment and generate reports according to the constraints.
If there are no constraints, software only perform free network adjustment and generates Free Network Adjustment Report. If there are WGS84 XYZ coordinates, WGS84 Lat/Lon/H coordinates, Local Lat/Lon/H coordinates or Local N/E/h coordinates as constraints, software will perform free network adjustment and constraint 3D adjustment, then generates Free Network Adjustment Report and Constraint 3D Adjustment Report.
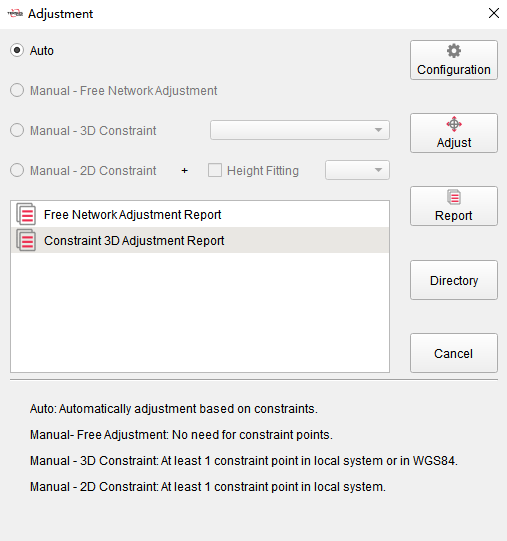
Figure 6.15 Adjustment
Click [Configuration] to open adjustment configuration dialog to modify the parameters during adjustment. Click [Adjust] in adjustment dialog to redo the adjustment. After adjustment, according to requirements and known coordinates, select report and click [Report] to view the report in the browser. Click [Directory] to open the directory where the reports is located. After adjustment, the coordinates in sites list will be displayed according to the adjustment results.
6.3.3 Adjustment Configuration
Click GNSS menu, click adjustment configuration, open the adjustment configuration dialog, where to edit parameters of quality threshold, weights and free network adjustment strategy during adjustment.
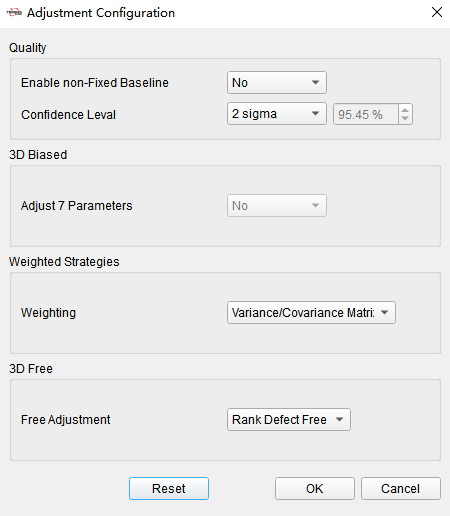
Figure 6.16 Adjustment Configuration
Enable non-Fixed Baseline The default is No, indicating that the non-fixed baselines will not participate in the network adjustment calculation.
Confidence Level The default is 2 sigma, optional 1 / 2 / 3 sigma, indicating confidence requirements in chi-square test in adjustment.
Adjust 7 Parameters Not configurable, indicating that 7 parameters are not used in adjustment.
Weighting The default is Variance / Covariance Matrix, can be changed to Fixed Standard and enter parameters, indicating baseline weighting strategy in adjustment.
Free Adjustment The default is Rank Defect Free, can be changed to Fixed One Point, indicating whether the coordinates of a site are fixed in free network adjustment.
6.3.4 Clear Adjustment Results
Click clear adjustment results to clear the results of adjustment and revert to the state when no adjustment was performed.
6.4 Lists and Charts
6.4.1 Sites
Click [Sites] button under GNSS menu, to display sites and sites information in list.
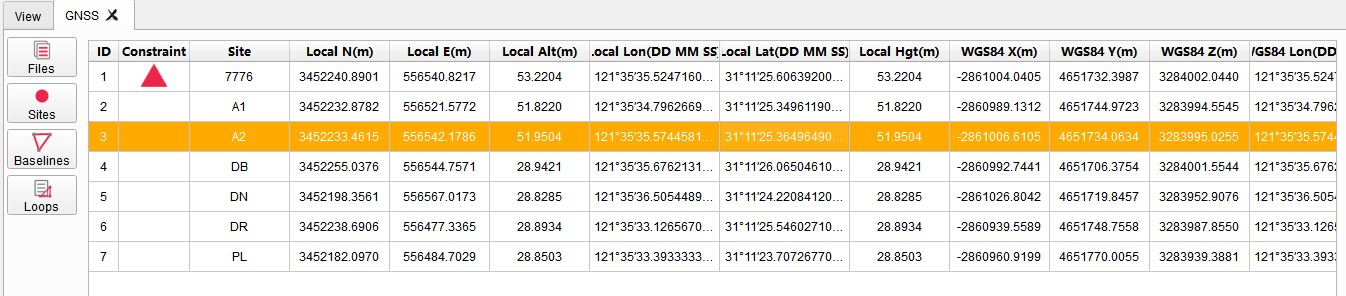
Figure 6.17 Sites List
Click to select sites, information and constraints can be modified in properties window. Right mouse click, to open site report, open site report directory or delete the site.
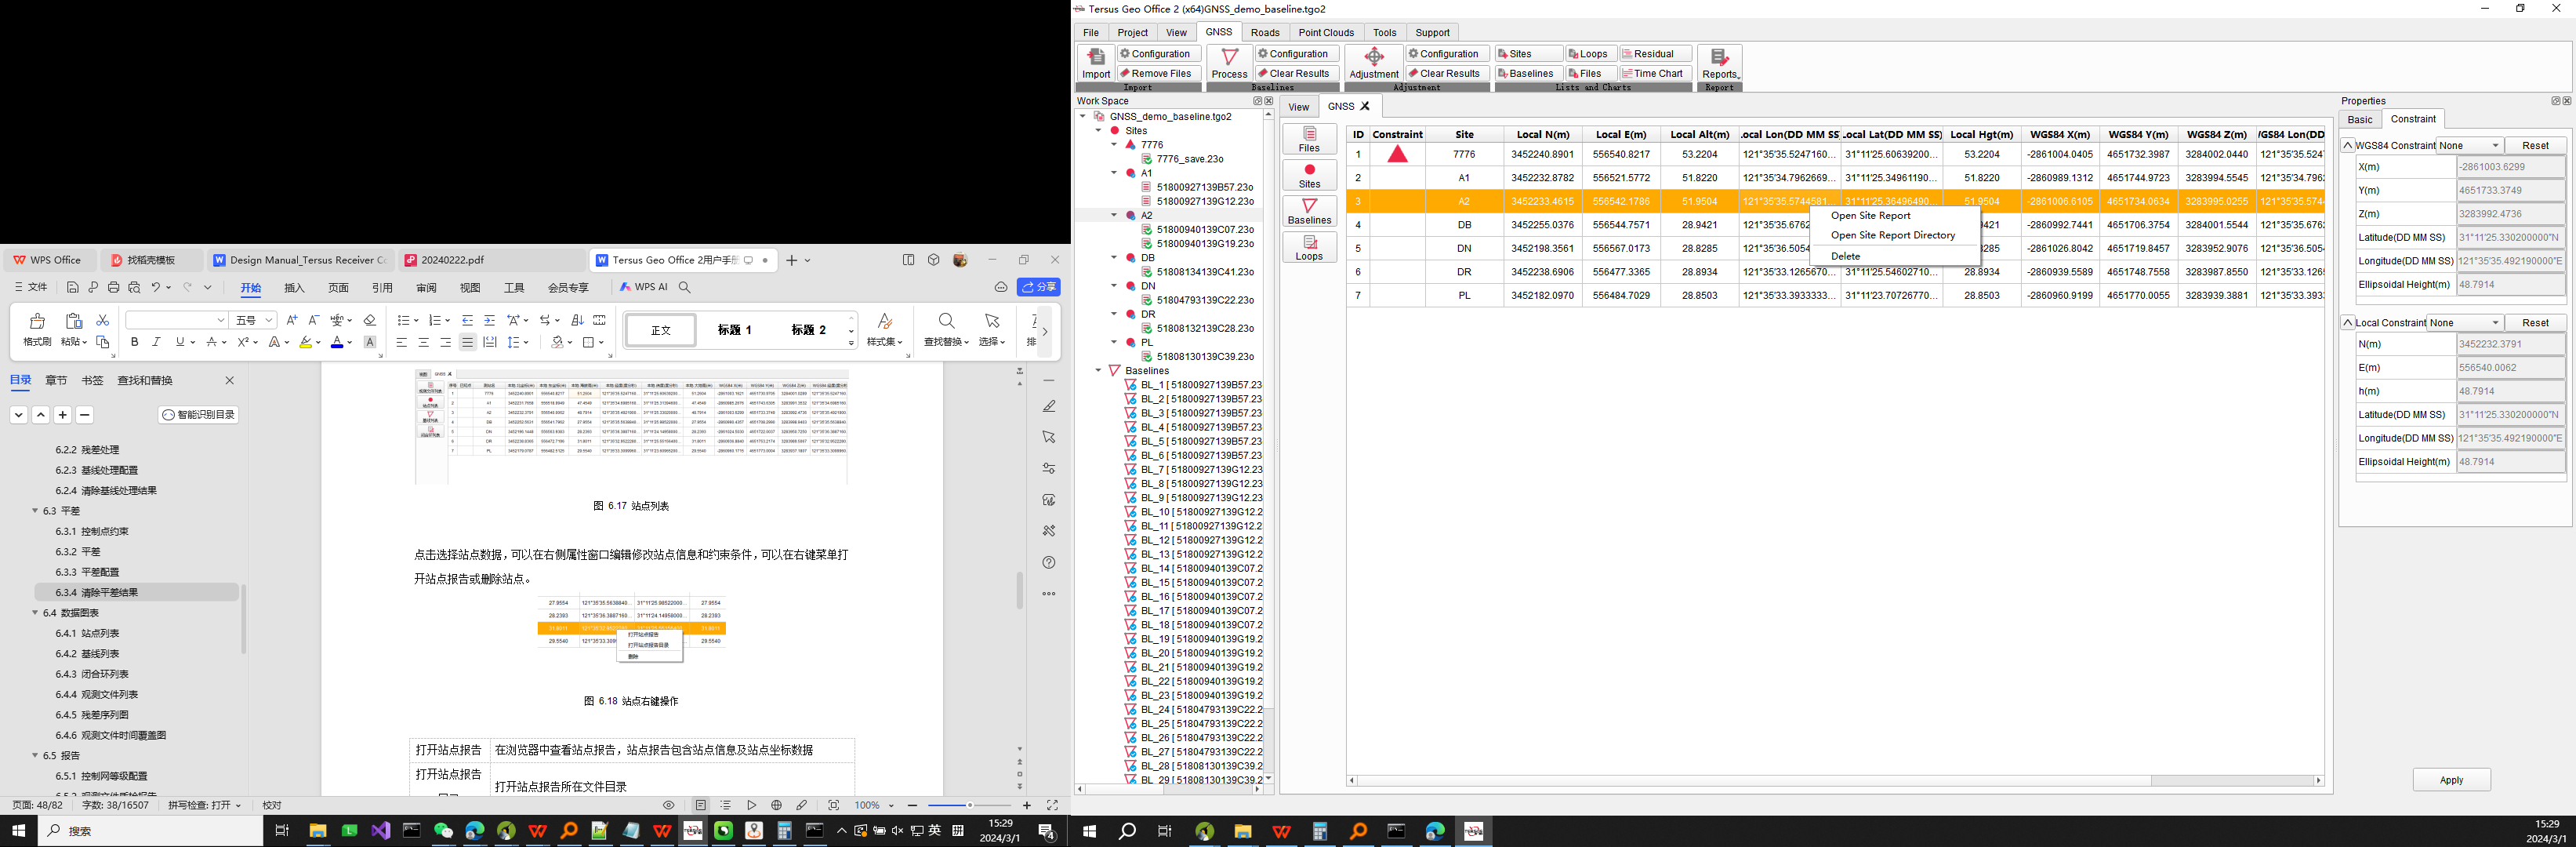
Figure 6.18 Sites Right Mouse Click
Open Site Report View site report in browser, containing sites information and coordinates.
Open Site Report Directory Open the directory where the site report is located.
Delete Delete selected site, associated observation files, baselines and loops.
6.4.2 Baselines
Click [Baselines] button under GNSS menu, to display baselines and information in list.
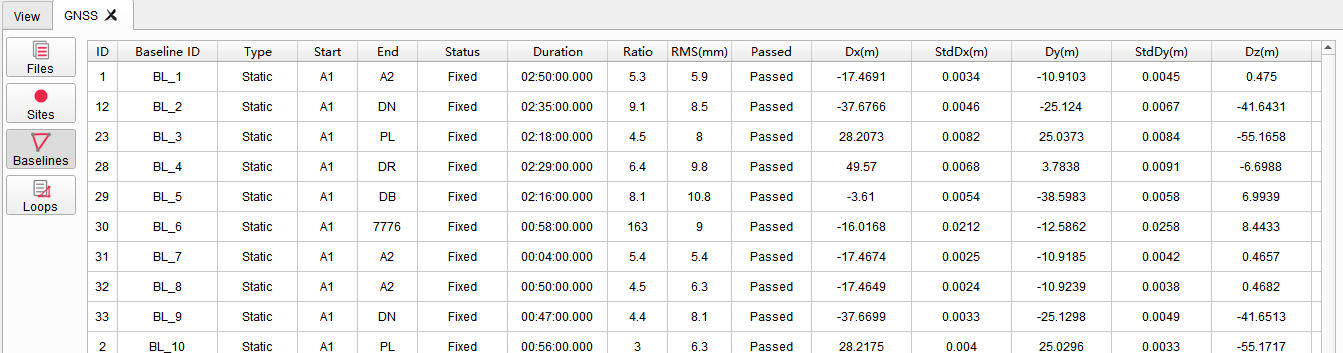
Figure 6.19 Baselines List
Right mouse click, to manipulate the selected baselines in the menu.
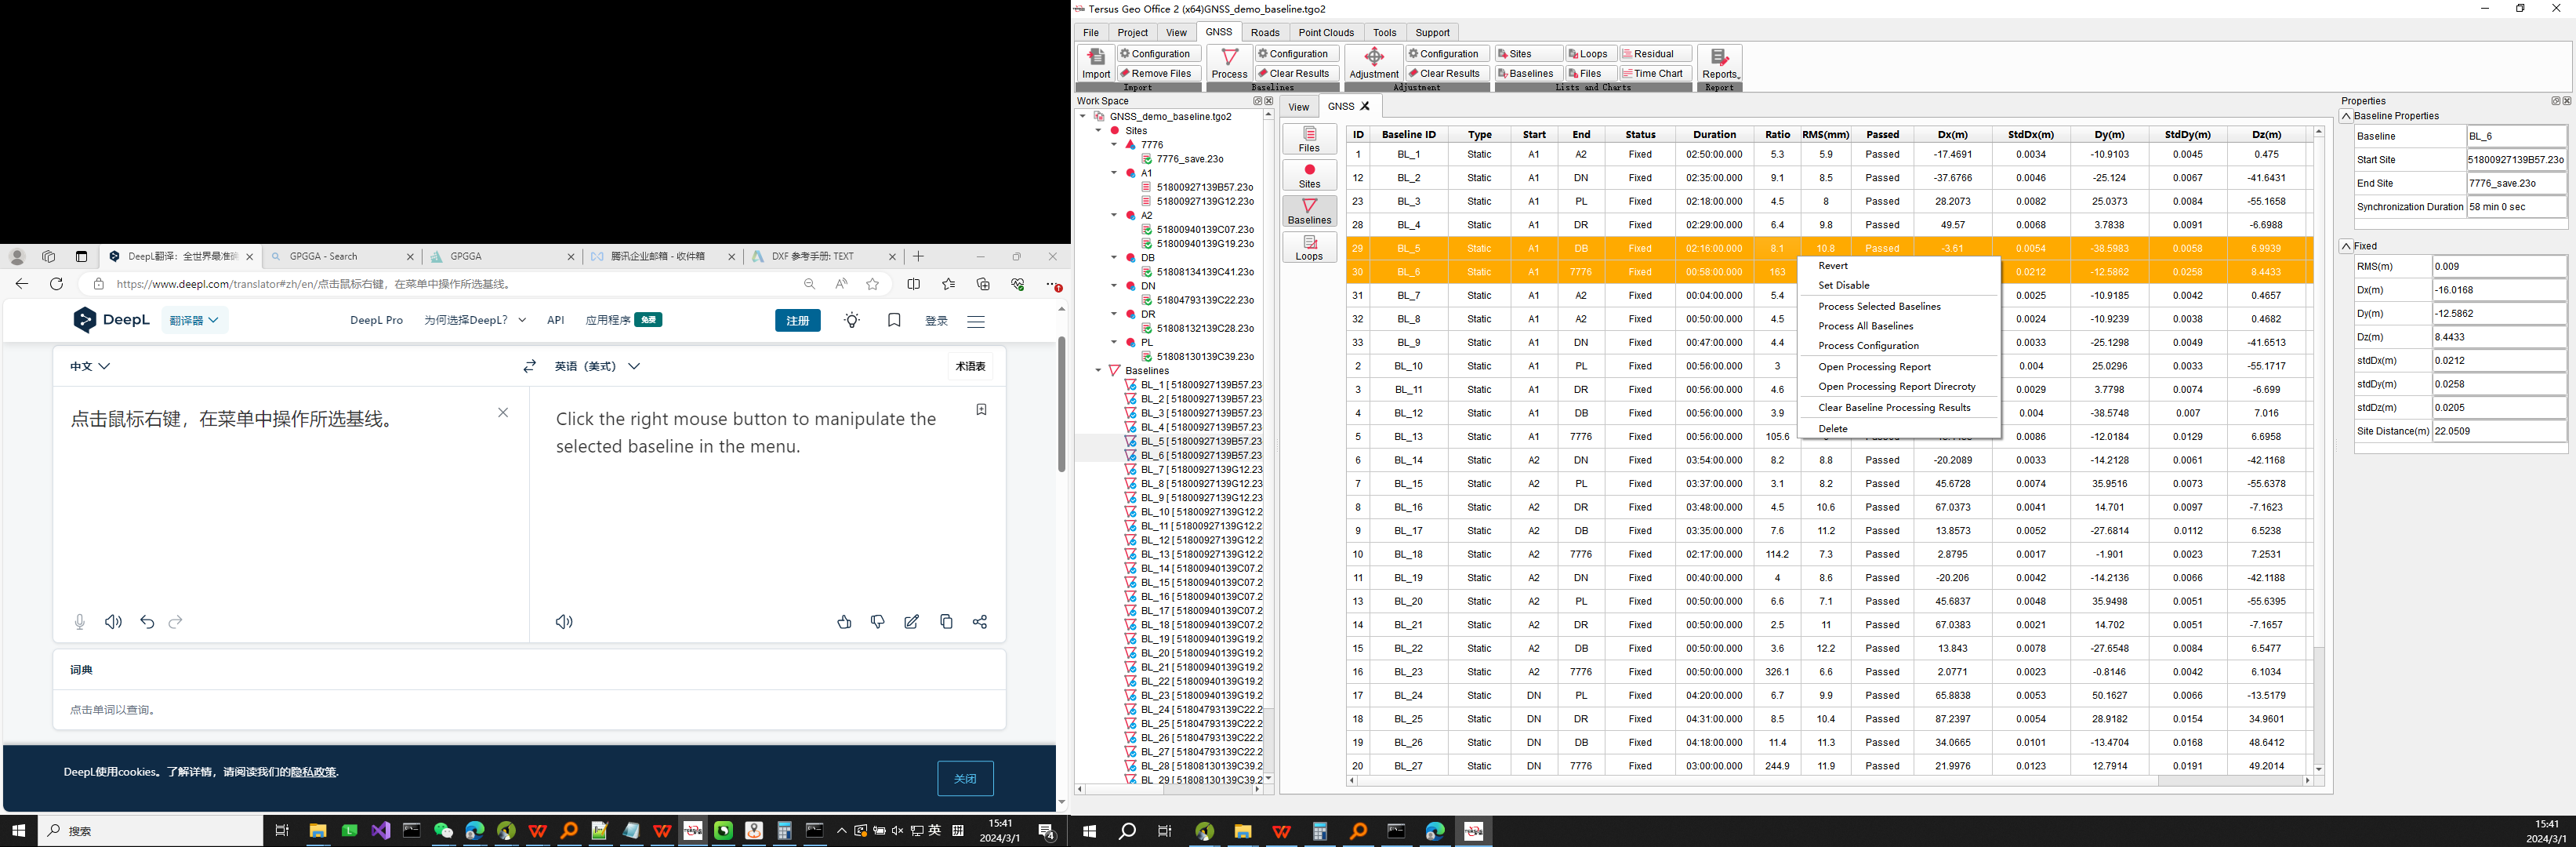
Figure 6.20 Baselines Right Mouse Click
+----------------------------+-----------------------------------------------------------------------------------+ | Revert | Revert baselines direction by change start and end sites. | +----------------------------+-----------------------------------------------------------------------------------+ | Set Enable/Disable | Enable or disable baselines, disabled baselines do not participate in processing. | +----------------------------+-----------------------------------------------------------------------------------+ | Process Selected Baselines | Perform baseline process on selected baselines. | +----------------------------+-----------------------------------------------------------------------------------+ | Process All Baselines | Perform baseline process on all baselines. | +----------------------------+-----------------------------------------------------------------------------------+ | Process Configuration | Open baseline process configuration dialog. | +----------------------------+-----------------------------------------------------------------------------------+ | Open Processing Report | Open baseline process report for selected baselines. | +----------------------------+-----------------------------------------------------------------------------------+ | Open Processing | Open directory where baseline process reports are located. | | | | | Report Directory | | +----------------------------+-----------------------------------------------------------------------------------+ | Clear Baseline | Clear baseline processing results. | | | | | Processing Results | | +----------------------------+-----------------------------------------------------------------------------------+ | Delete | Delete the selected baselines, and corresponding loops. | +----------------------------+-----------------------------------------------------------------------------------+
6.4.3 Loops
Click [Loops] button under GNSS menu, to display loops and information in list.
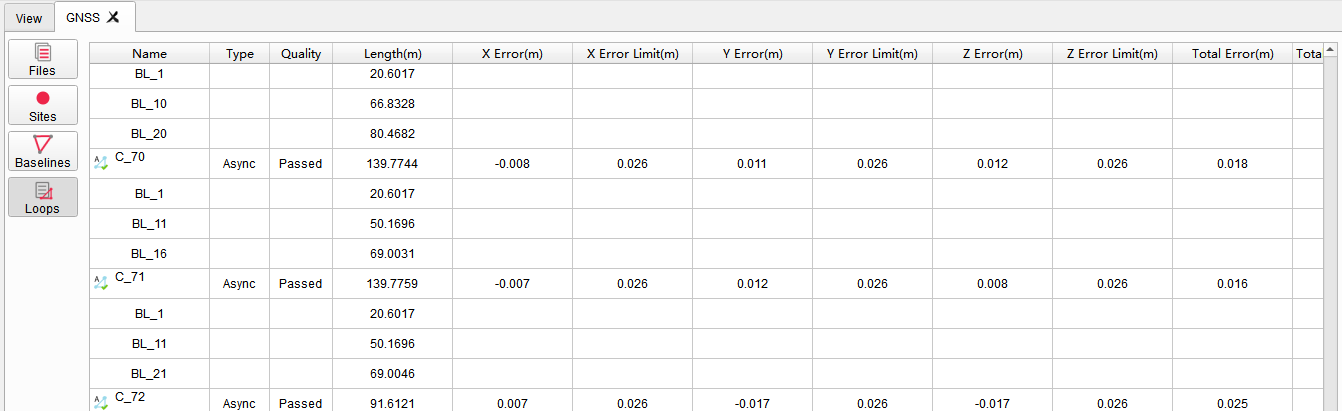
Figure 6.21 Loops List
Right mouse click, to open loop report, open loop report directory or delete the loop.
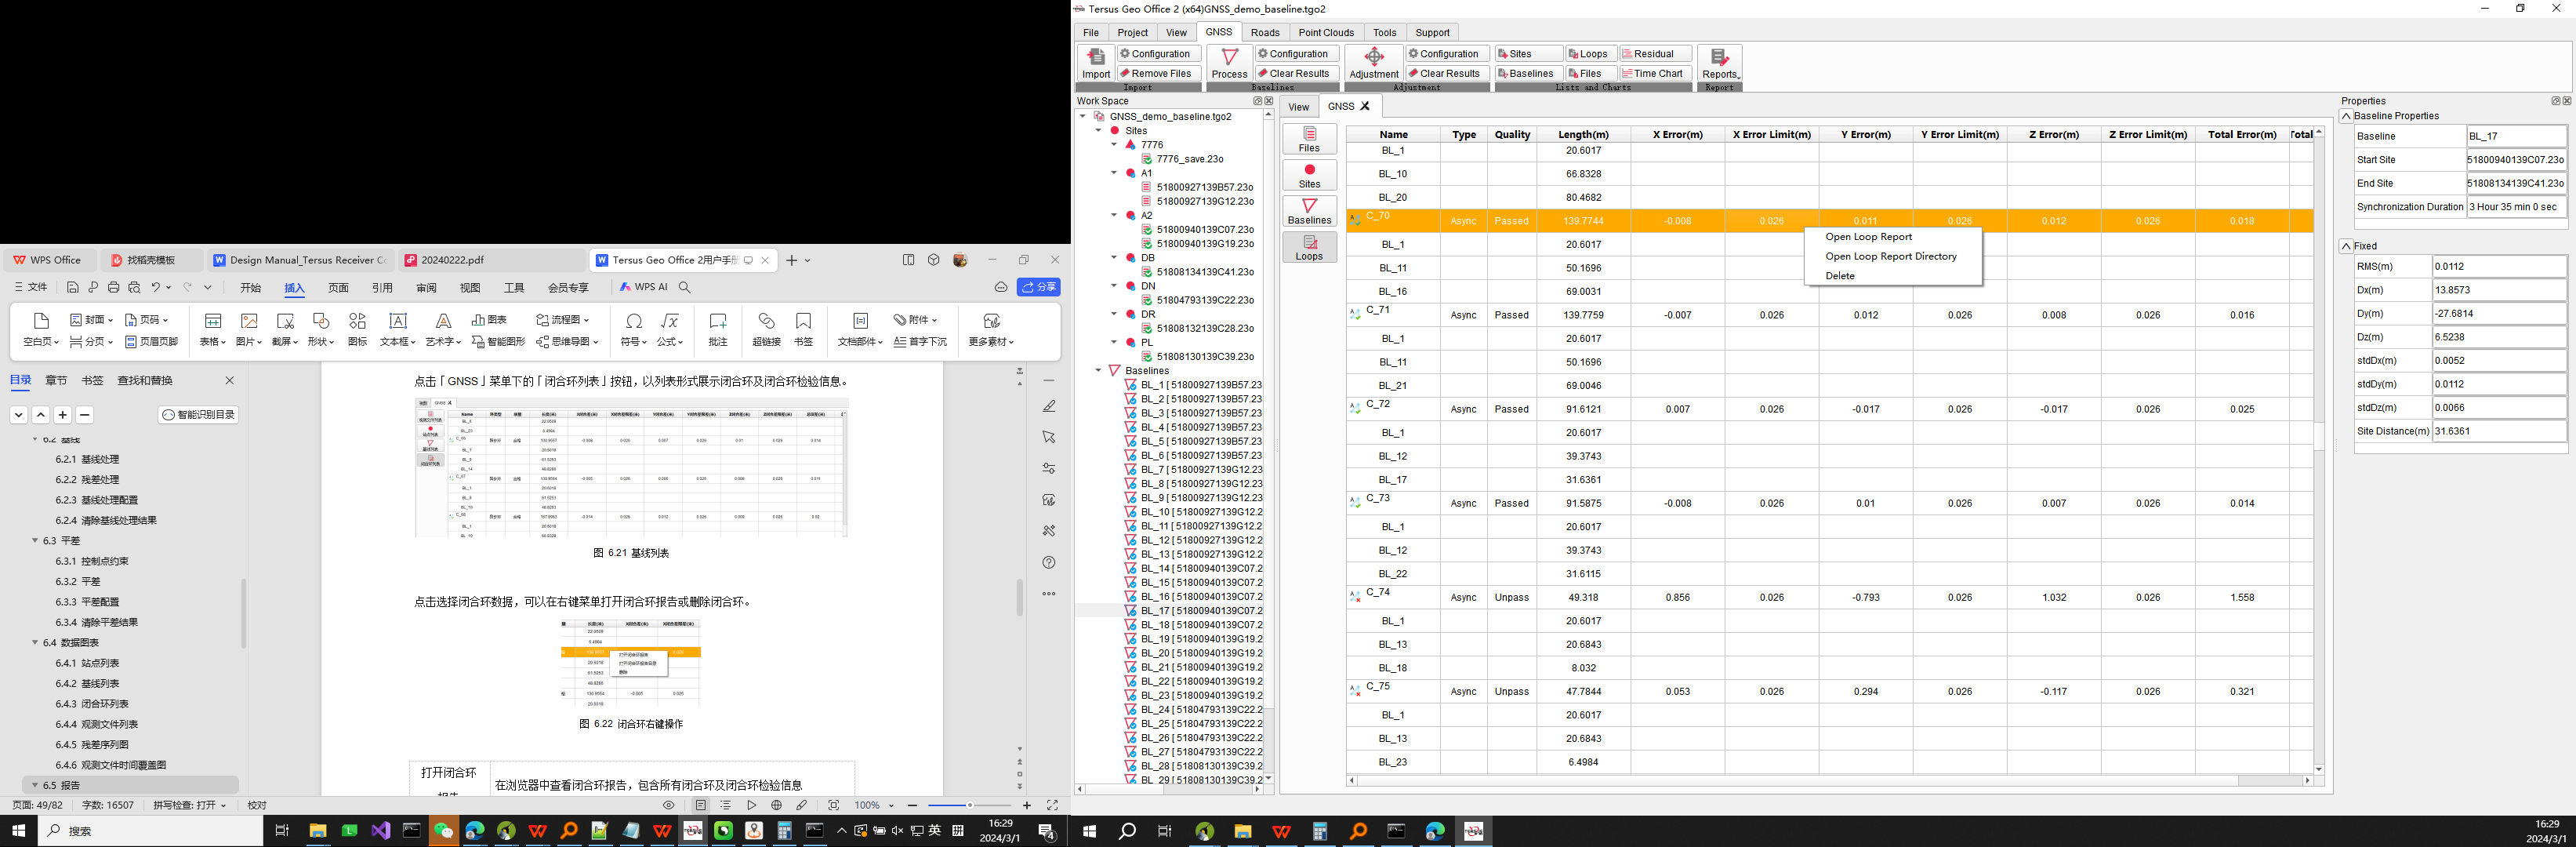
Figure 6.22 Loops Right Mouse Click
+------------------+--------------------------------------------------------------------------------------+ | Open Loop Report | View loop report in browser, containing loops parameters and inspection information. | +------------------+--------------------------------------------------------------------------------------+ | Open Loop | Open the directory where the loop report is located. | | | | | Report Directory | | +------------------+--------------------------------------------------------------------------------------+ | Delete | Delete selected loops. | +------------------+--------------------------------------------------------------------------------------+
6.4.4 Files
Click [Files] button under GNSS menu, to display files and information in list.
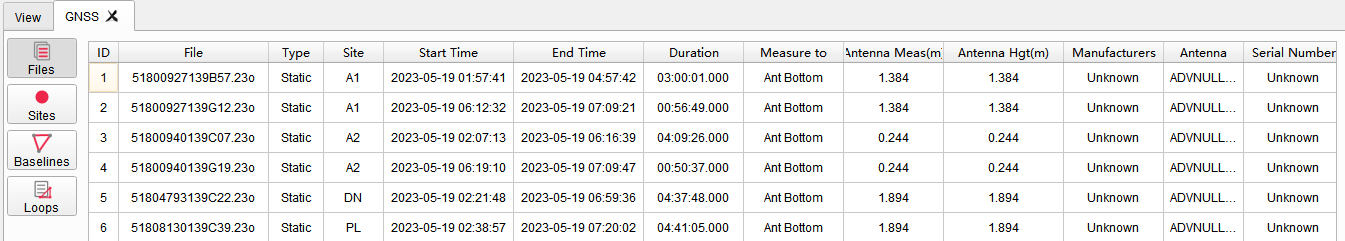
Figure 6.23 Files List
Right mouse click, to manipulate the selected files in the menu.
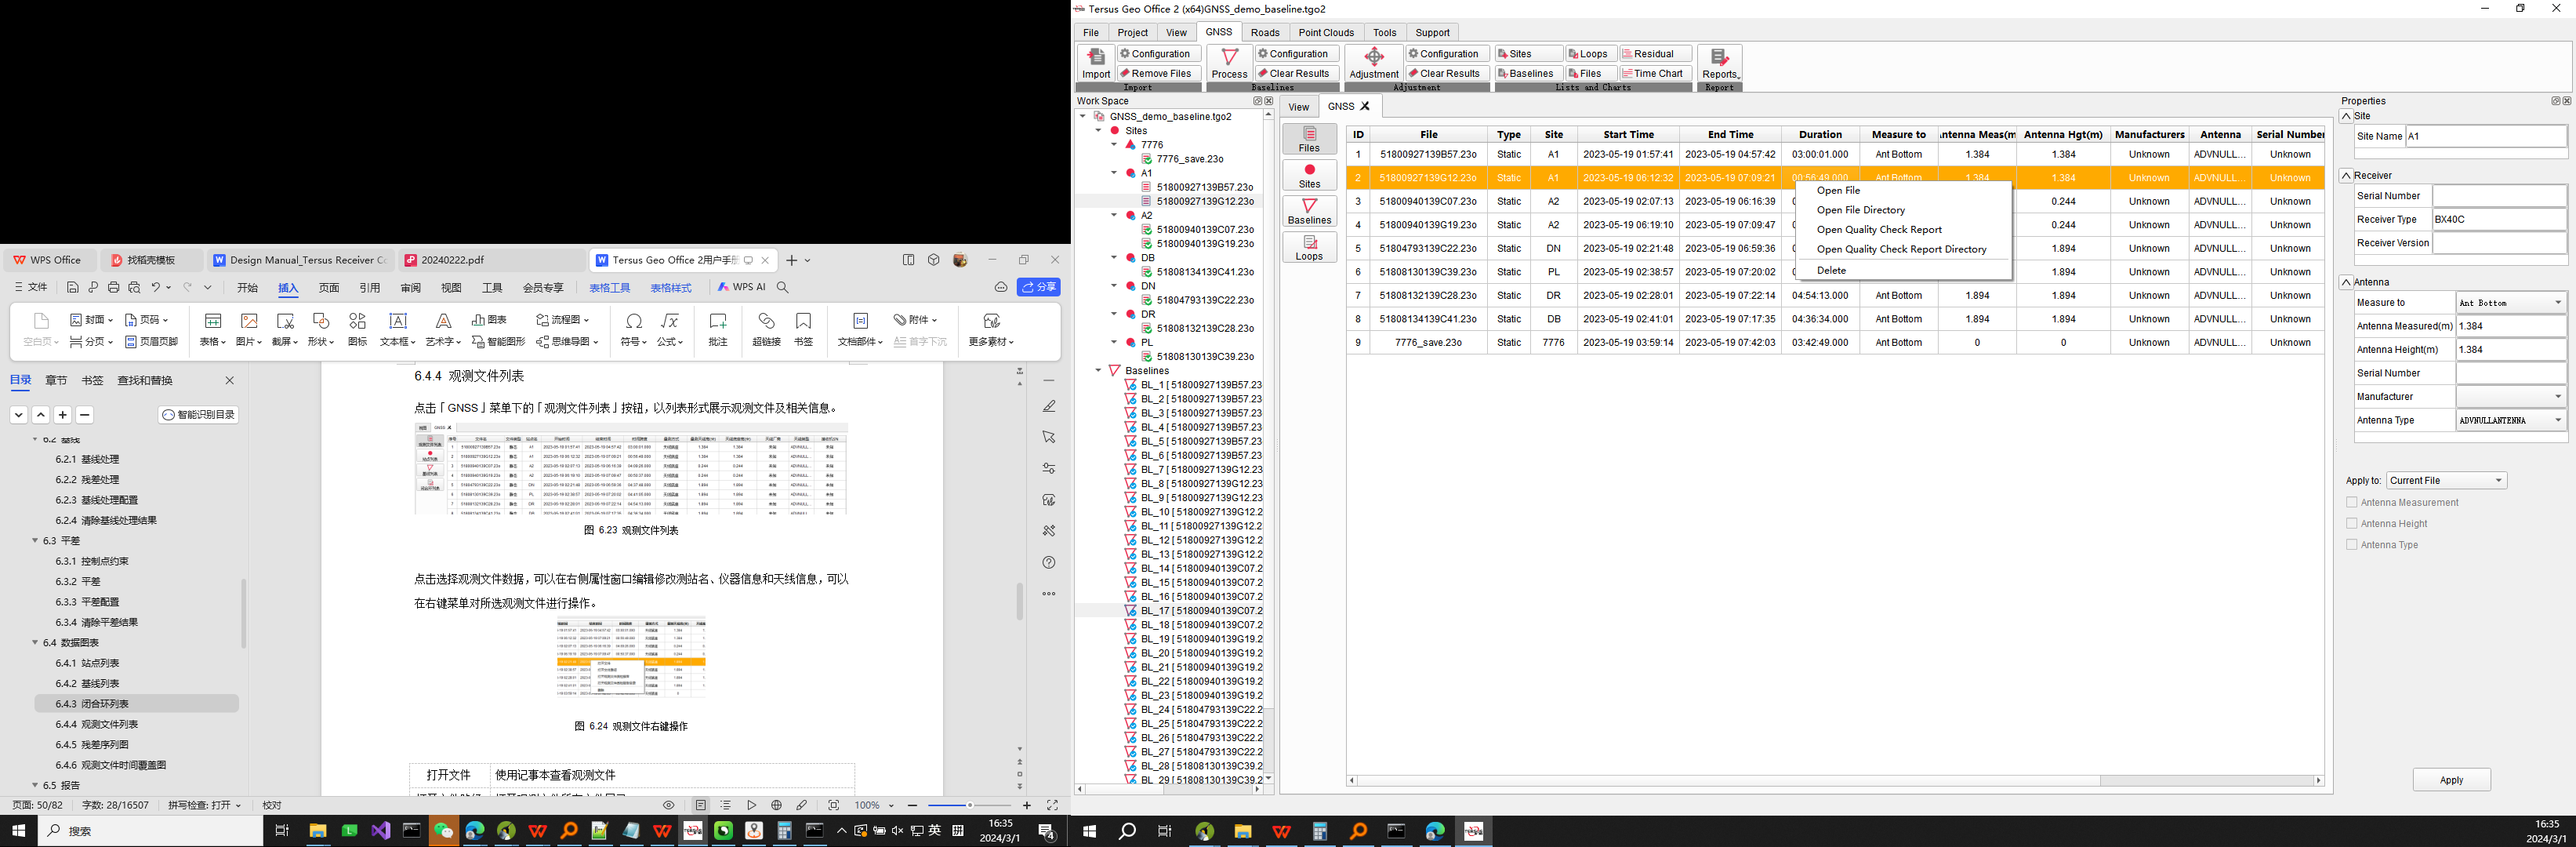
Figure 6.24 Files Right Mouse Click
Open File View files in notepad.
Open File Directory Open the directory where the file is located.
Open Quality Check Report View quality check report in browser, containing rate and multi-path information.
Open Quality Check Report Directory Open the directory where the quality check report is located.
Delete Delete the selected files, corresponding sites and baselines.
6.4.5 Residual
Select the baseline after processed, click [Residual] button under GNSS menu, to display residuals during baseline processing.
Figure 6.25 Residual Plot
In residual interface, modify the satellites and observations according to residuals to improve the precision.
6.4.6 Time Chart
After importing GNSS files, click [Time Chart] button under GNSS menu, to display time and synchronization coverage of files.
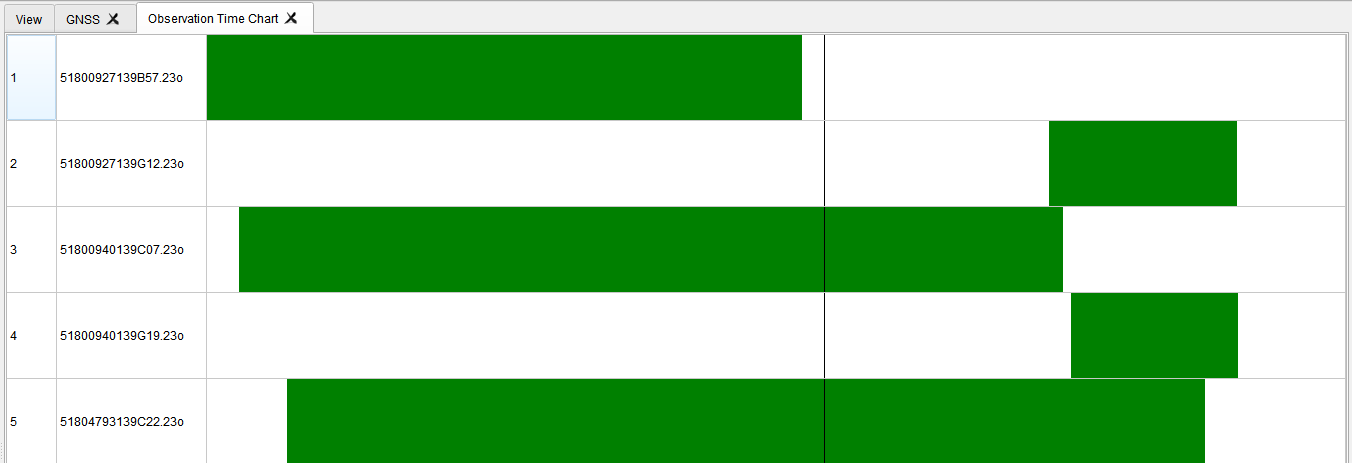
Figure 6.26 Time Chart
6.5 Report
6.5.1 Tolerance Configuration
Click GNSS menu, click [Reports] button, and then click [Tolerance Config] in the drop-down menu to open Tolerance Configuration dialog. Configure tolerance parameters, software will calculate error limits of loops according to the fixed error and scaling error to determine whether loops passes or not.
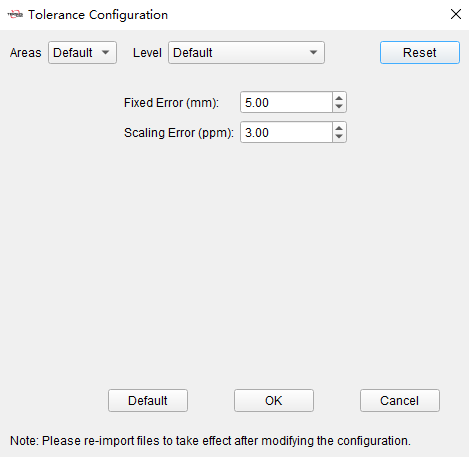
Figure 6.27 Tolerance Configuration
6.5.2 Quality Check Report
Select observation file in files list, click [Reports] button under GNSS menu, and then click [Quality Check Report] in the drop-down menu, to open quality check report of selected observation file in the browser, containing rate and multi-path information.
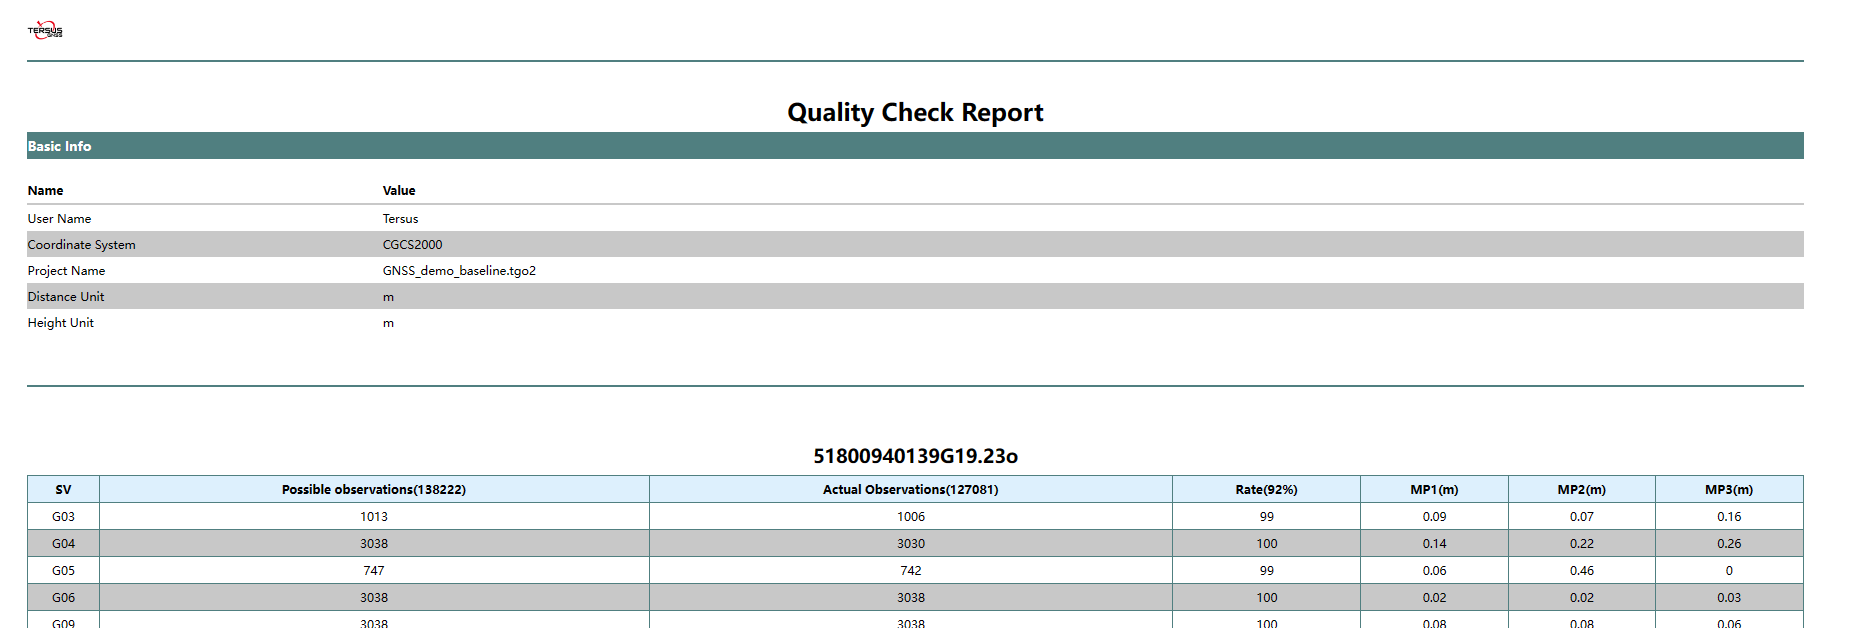
Figure 6.28 Quality Check Report
6.5.3 Baseline Process Report
Select one or several baselines in baselines list, click [Reports] button under GNSS menu, and then click [Baseline Process Report] in the drop-down menu, to open baseline process report in browser, containing baselines information and processing results.
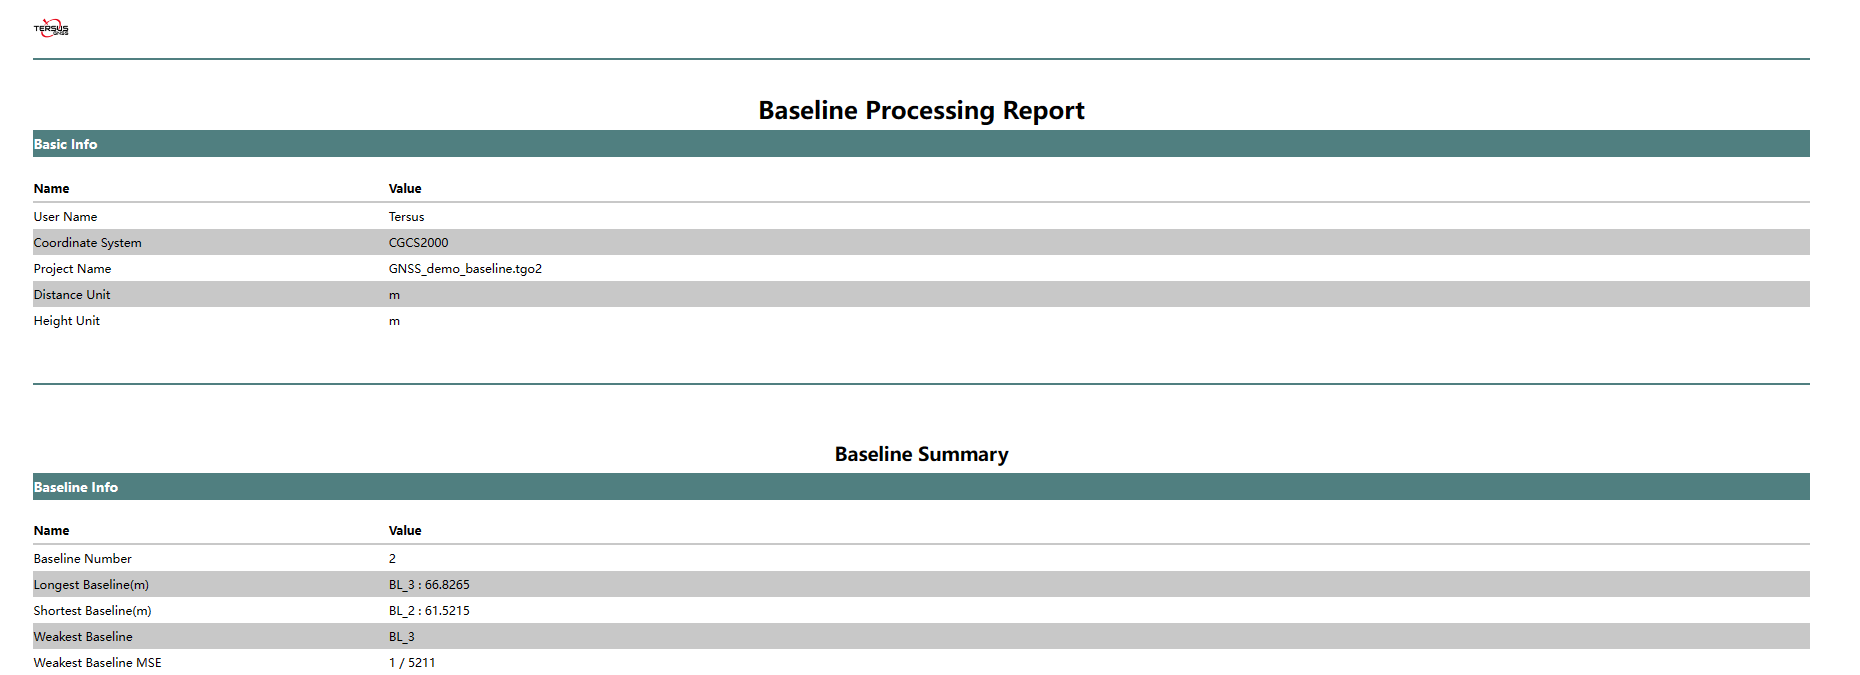
Figure 6.29 Baseline Process Report
6.5.4 Loop Report
After baselines processing, click [Reports] button under GNSS menu, and then click [Loop Report] in the drop-down menu, to open loops report in browser, containing loops parameters and inspection information.
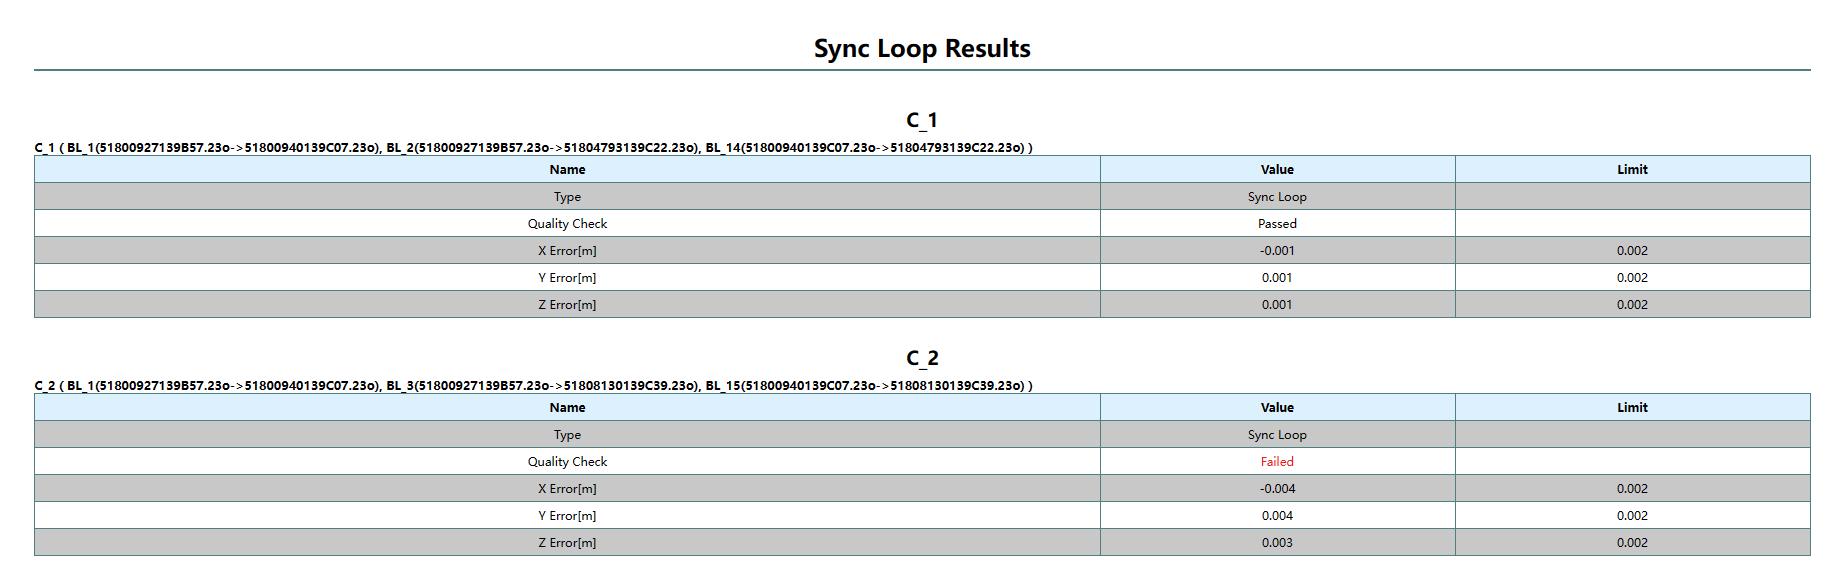
Figure 6.30 Loops Report
6.5.5 Adjustment Report
After network adjustment, click [Reports] button under GNSS menu, and then click [Adjustment Report] in the drop-down menu, to open adjustment report in browser, containing adjustment results and sites coordinates.
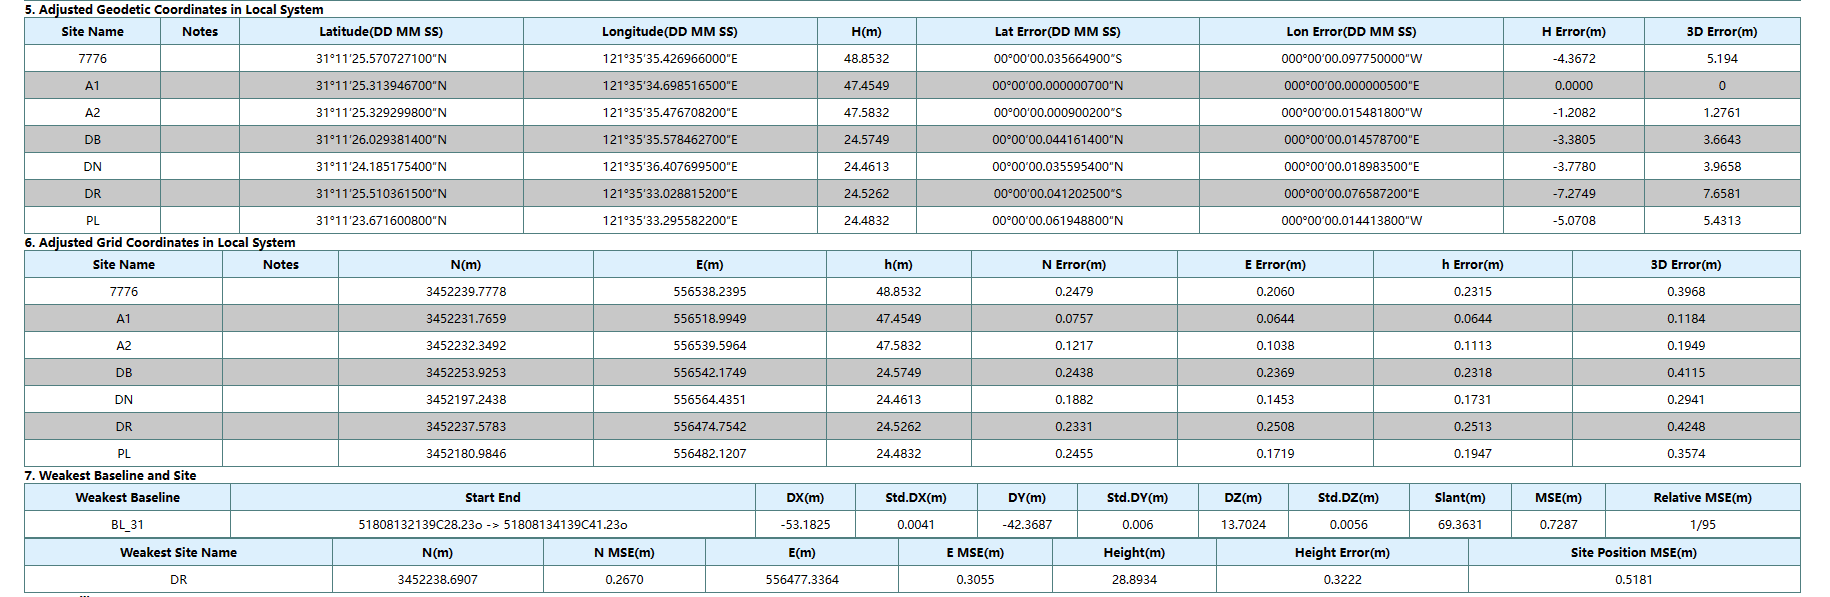
Figure 6.31 Adjustment Report
6.5.6 Site Report
Click [Reports] button under GNSS menu, and then click [Site Report] in the drop-down menu, to open sites report in browser, containing sites information and coordinates.
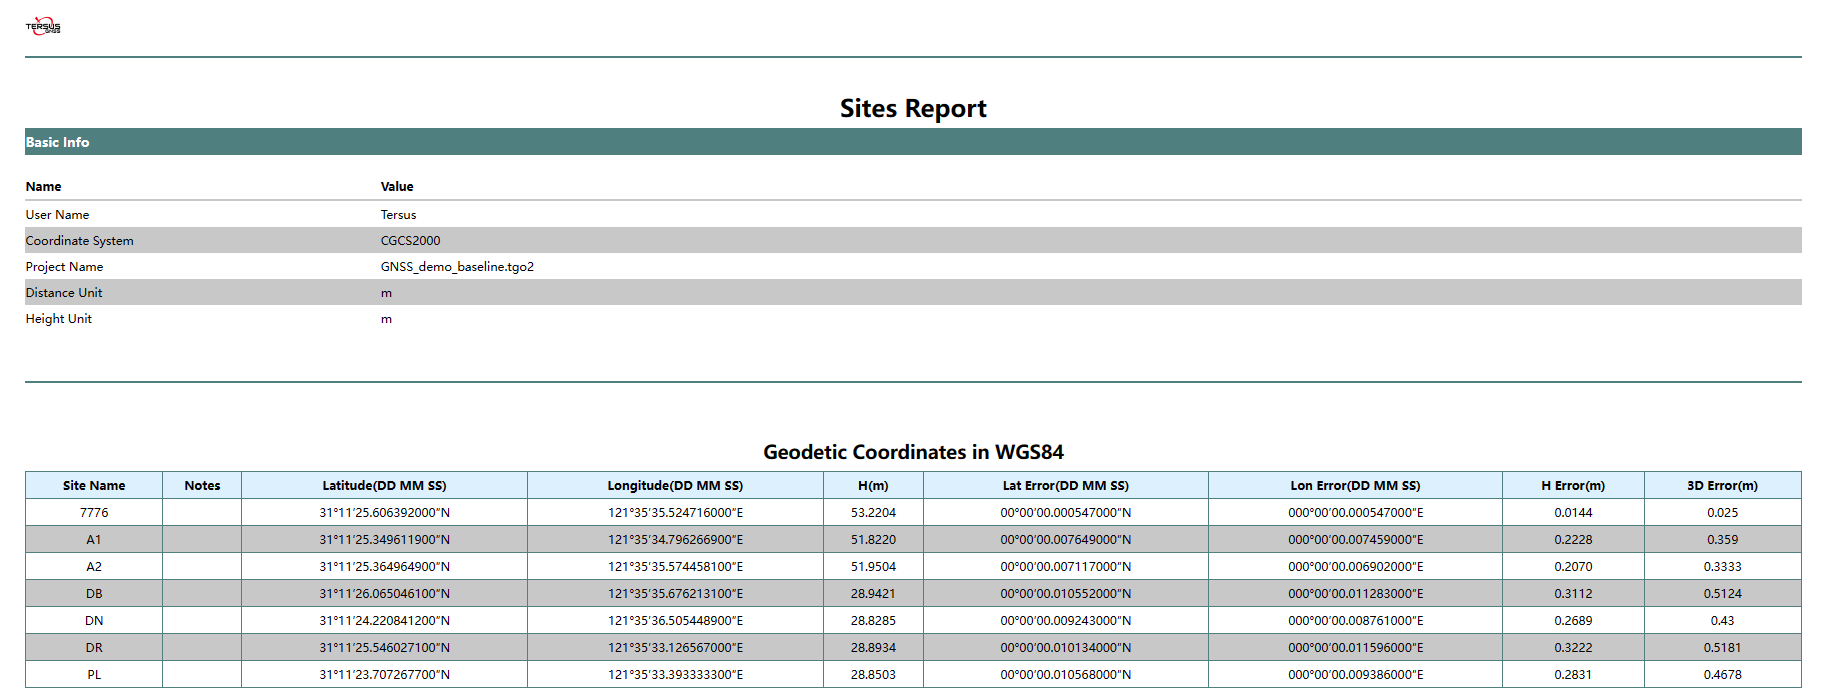
Figure 6.32 Sites Report
6.5.7 Open the Report Directory
Click [Reports] button under GNSS menu, and then click [Open the Report Directory] in the drop-down menu, to open directory where reports are located in.